PROCESS CONTINUOUS IMPROVEMENT ENGINEERING
PROCESS CONTINUOUS IMPROVEMENT ENGINEERING
1. KAIZEN IMPROVEMENT
2. PROCESS IMPROVEMENT SELECTION BY A MATRIX
3. PRODUCTION OR MAINTENANCE EFFICIENCIES ANALYSIS
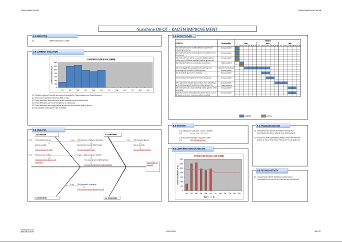
KAIZEN IMPROVEMENT
1.0 OBJECTIVE
Clear simple description
2.0 CURRENT SITUATION
Bar graph of values and points arising from the situation
3.0 ANALYSIS
Fish bone chart with 3.1.0 PERSON, 3.2.0 MATERIAL, 3.3.0 METHOD & 3.4 .0 MACHINE
4.0 ACTIVITY PLAN
Gantt chart
5.0 SAVINGS
Points arising from savings and simple calculations
6.0 CONFIRMATION OF RESULTS
Bar graph of values and target line
7.0 STANDARDISATION
Points arising for standardisation
8.0 FUTURE ACTIVITY
Points arising for future improvement
Sample of Process improvement projects via
PROCESS IMPROVEMENT SELECTION BY A MATRIX
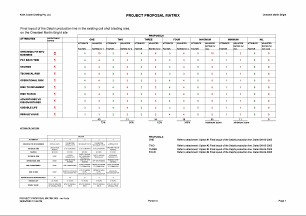
Sample of Project proposal Matrix for the selection of alternative ideas
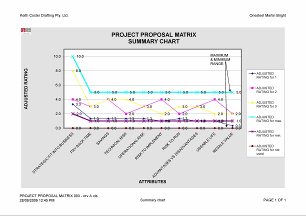
Sample of Project proposal Matrix Summary chart for the selection of alternative ideas
Project proposal Matrix
Attributes that are critical for the business are listed by a steering group, including the attribute factors that are used for scoring a selection
A number of different proposals for the single project would be tabled
Independent persons of the steering group review and score each of the tabled proposals
A summary line graph displays how the each different proposal scored.
This is a clinical way of choosing a suitable project within a group.
PROCESS IMPROVEMENT ENGINEERING
Production or maintenance efficiencies analysis
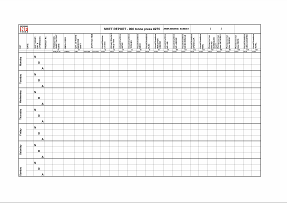
Sample of daily time sheet scoring production or maintenance efficiencies

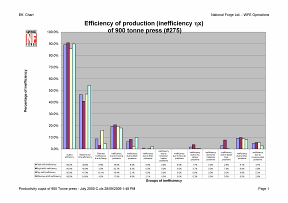
Sample of Pareto of efficiencies d-time Chart scoring production or maintenance from daily time sheet
Sample of Current output efficiency of production Chart Current standard vs Actual from daily time sheet

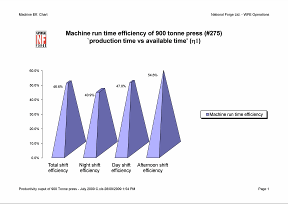
Sample of Machine run time efficiency Chart Production time vas available time from daily time sheet
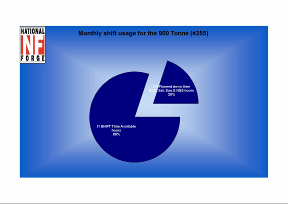
Sample of Monthly shift usage efficiency Chart from daily time sheet
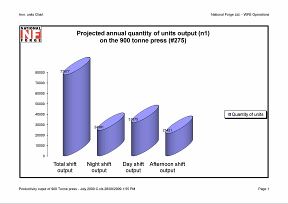
Sample of Projected annual quantity of units output Chart from daily time sheet